It has been some time since I’d last seen inside the hive. During and following the inspection, I was once again inspired to find a way to monitor their progress. Although primarily due of self-interest as I find the hive fascinating, monitoring a hive poses both some interesting technical problems, and a platform on which to actually quantify their status. Such information could become much more valuable in future when we have more hives, as it would be possible to establish a baseline from which to detect for anomalies early. But again, mostly because beehives are cool.
Proof of Concept Monitor and Transmitter
I’d been discussing these ideas with Tom, who you might remember from the lightstick project as being the half of the newly created Sam and Tom Industrys venture, who is actually capable of making things with electronics.
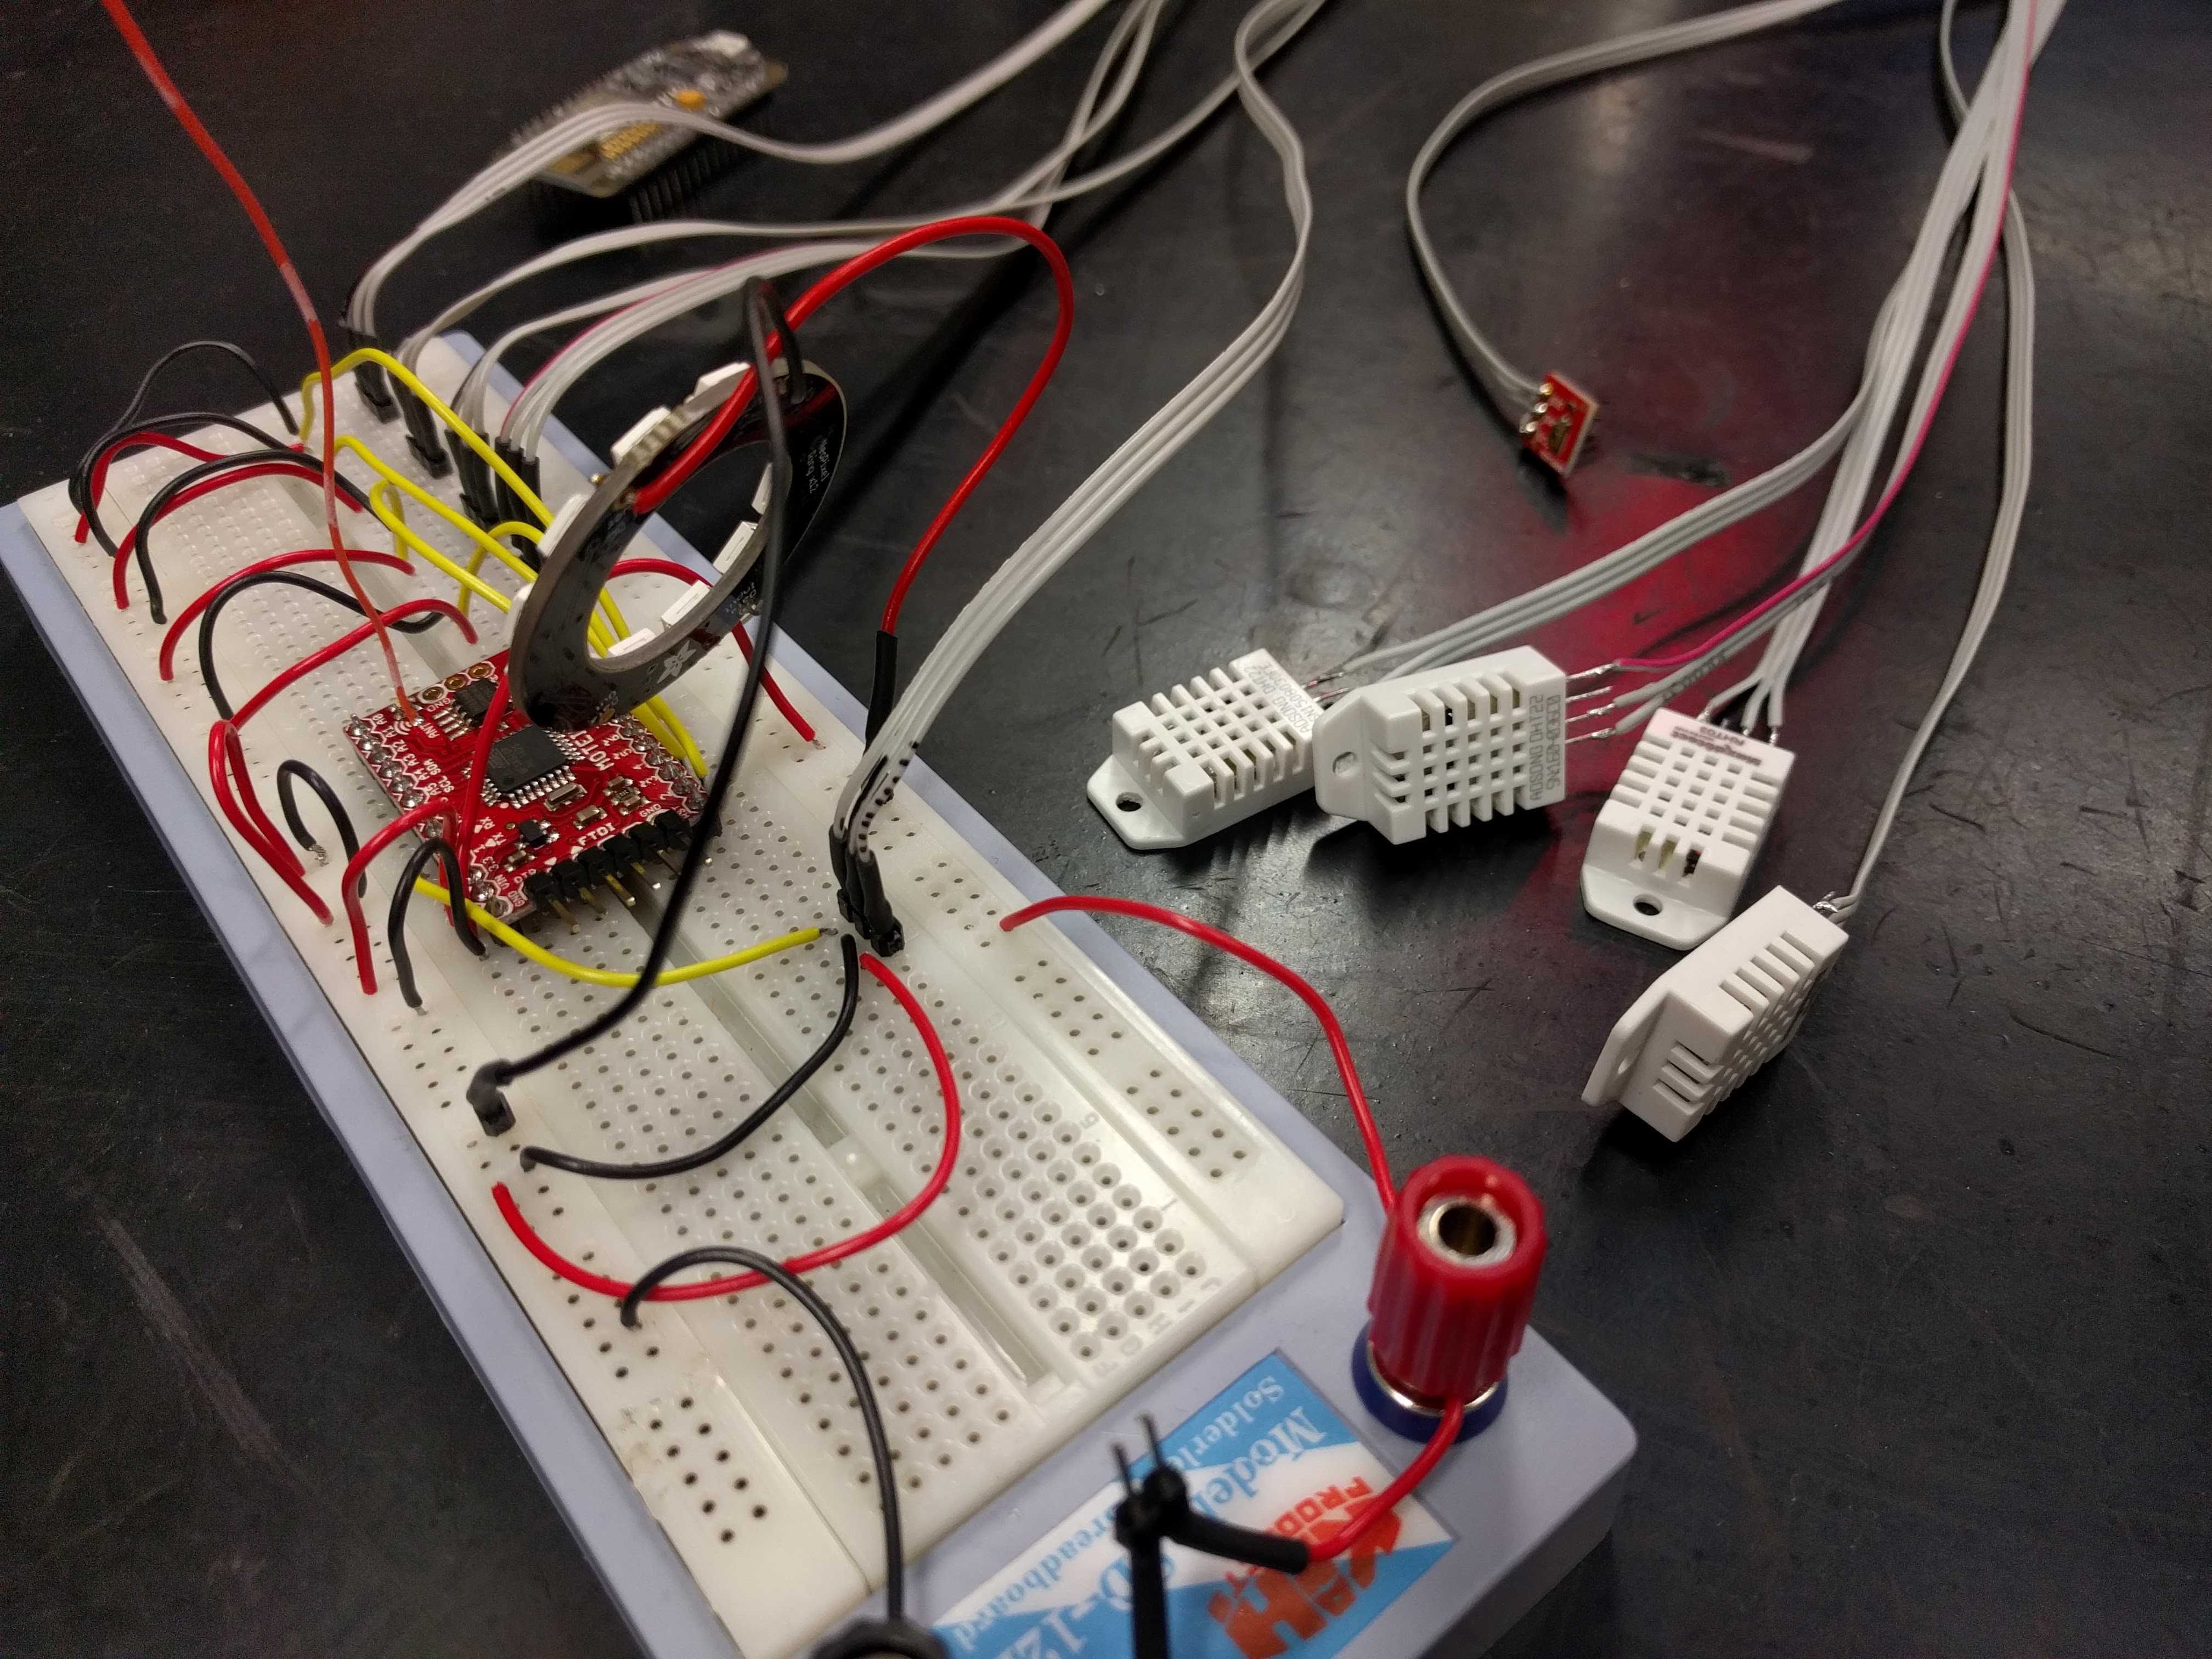
We began assembling a quick proof of concept. Handily, Tom had a bunch of DHT22 temperature and humidity sensors lying around which provided a good start. Regarding a microcontroller, I’ve wanted an excuse to play with radio communication for some time, and this was a nice opportunity to try out a pair of Moteino R4s. We also discussed a future idea to use Bluetooth because the idea of pairing my phone with a beehive during an inspection seemed both amusing, and a useful way to download data that is less practical to transmit over radio to a device.
We set to work. Tom retrofitted some code he had previously written to manage wireless comms between Moteinos, while I cut and badly stripped some wires. After some breadboard battling, we had a working prototype in quarter of an hour. Not content with this, we attached the sensors to lengths of flat cable, added a TEMT6000 ambient light sensor and a NeoPixel ring for no particular reason other than the fact we love NeoPixels so much.
Base Station Prototype Receiver
We verified that the packets containing the sensor data were being broadcast. The Moteino queries the sensors and loads the results into a struct which is then transmitted over radio as binary by the RMF69 library. Now we needed a base station to pick up the transmissions and do something interesting.
We already had packet handling and receiving code for the second Moteino, but as we’d decided (for the time being at least) that the endpoint for the sensor data was to be hosted on the internet, we needed WiFi. Enter our WiFi enabled friend: the ESP8266.
We needed to establish a software serial link between the Moteino and ESP8266, a trivial use-case that can be solved by the Arduino SoftwareSerial library. I did encounter some familiar confusion arising from our trusty pinout diagram, connecting the marked RX and TX pins on the NodeMCU to the Moteino interfered with my ability to actually program it. We instead set the RX/TX pins to the unused D1 and D2 respectively.
The receiving Moteino captures each transmitted packet, reads the first byte to determine its type (we’ve defined only one, but it’s good to future proof early) and if it is the right size, passes the binary data through its serial interface to the ESP8266 before returning an acknowledgement to the transmitting Moteino.
The NodeMCU uses the ESP8266WiFi library to establish a connection to the SSID defined in our configuration file. The ESP8266 Arduino repository serves as both a helpful lookup of the source, and typically features examples of each library.
Once connection to the designated SSID has been negotiated, the controller listens to the software serial receive pin for data. When available, the first byte is read (as before on the Moteinos) to determine the packet type. If the packet type is valid, we listen for as many bytes as necessary to fill the struct for that particular packet type. We ran in to a lot of head scratching here, eventually discovering that our packet structs were larger than calculated, as uint8_t‘s are packed with 3 leading bytes to align them to the architecture of the NodeMCU. This caused us almost an hour of debugging many off-by-some-bytes oddities in our packet handling.
Once a valid packet’s binary stream has been loaded into the appropriate struct, we translate it to a JSON string via the rather helpful ArduinoJSON library. As the ESP8266HTTPClient requires a char* payload, I wasn’t sure of the correct way to actually transmit the JSONObject, so I rather unpleasantly abused its printTo function to write it into a fixed size char array:
[...]
    StaticJsonBuffer<256> jsonBuffer;
    JsonObject& json = jsonBuffer.createObject();

    jsonifyPayload(json, payload, pkt_type);

    http.begin(endpoint, fingerprint);
    http.addHeader("Content-Type", "application/json");

    char msg[256];
    json.printTo(msg);
    Serial.print(msg);

    int httpCode = http.POST(msg);
[...]
Note the fingerprint in the http.begin: a required parameter containing the SHA1 fingerprint of the endpoint address if you are attempting to use HTTPS. Without this, the library will just refuse to make the connection. It would have been trivial to diagnose this earlier if we could actually work out how to properly enable debug messages from the ESP8266HTTPClient library. Despite our best attempts, we had to force the debug mechanism to work by manually editing away the guards around the #define DEBUG_HTTPCLIENT header, in the installed packages directory. No idea why. Grim.
Other time wasted involved a lot of tail chasing given after what appeared to be the delivery of a successful POST request, a httpCode of -5. It would later turn out that the Python SimpleHTTPServer example I lazily downloaded from the web failed to set the headers of the response to the POST request, causing the ESP8266HTTPClient to believe the connection to the server was lost (an all-else-fails assumption it makes if it is unable to parse a response from the server). The -5 refers to a definition in the library header: #define HTTPC_ERROR_CONNECTION_LOST (-5).
Finally, we received HTTP_CODE_OK responses back from our test server, which happily dumped our JSON response to the terminal on my laptop…. After I remembered to join the WiFi network we’d connected the NodeMCU to, at least.
The Web Interface: Back from the Dead
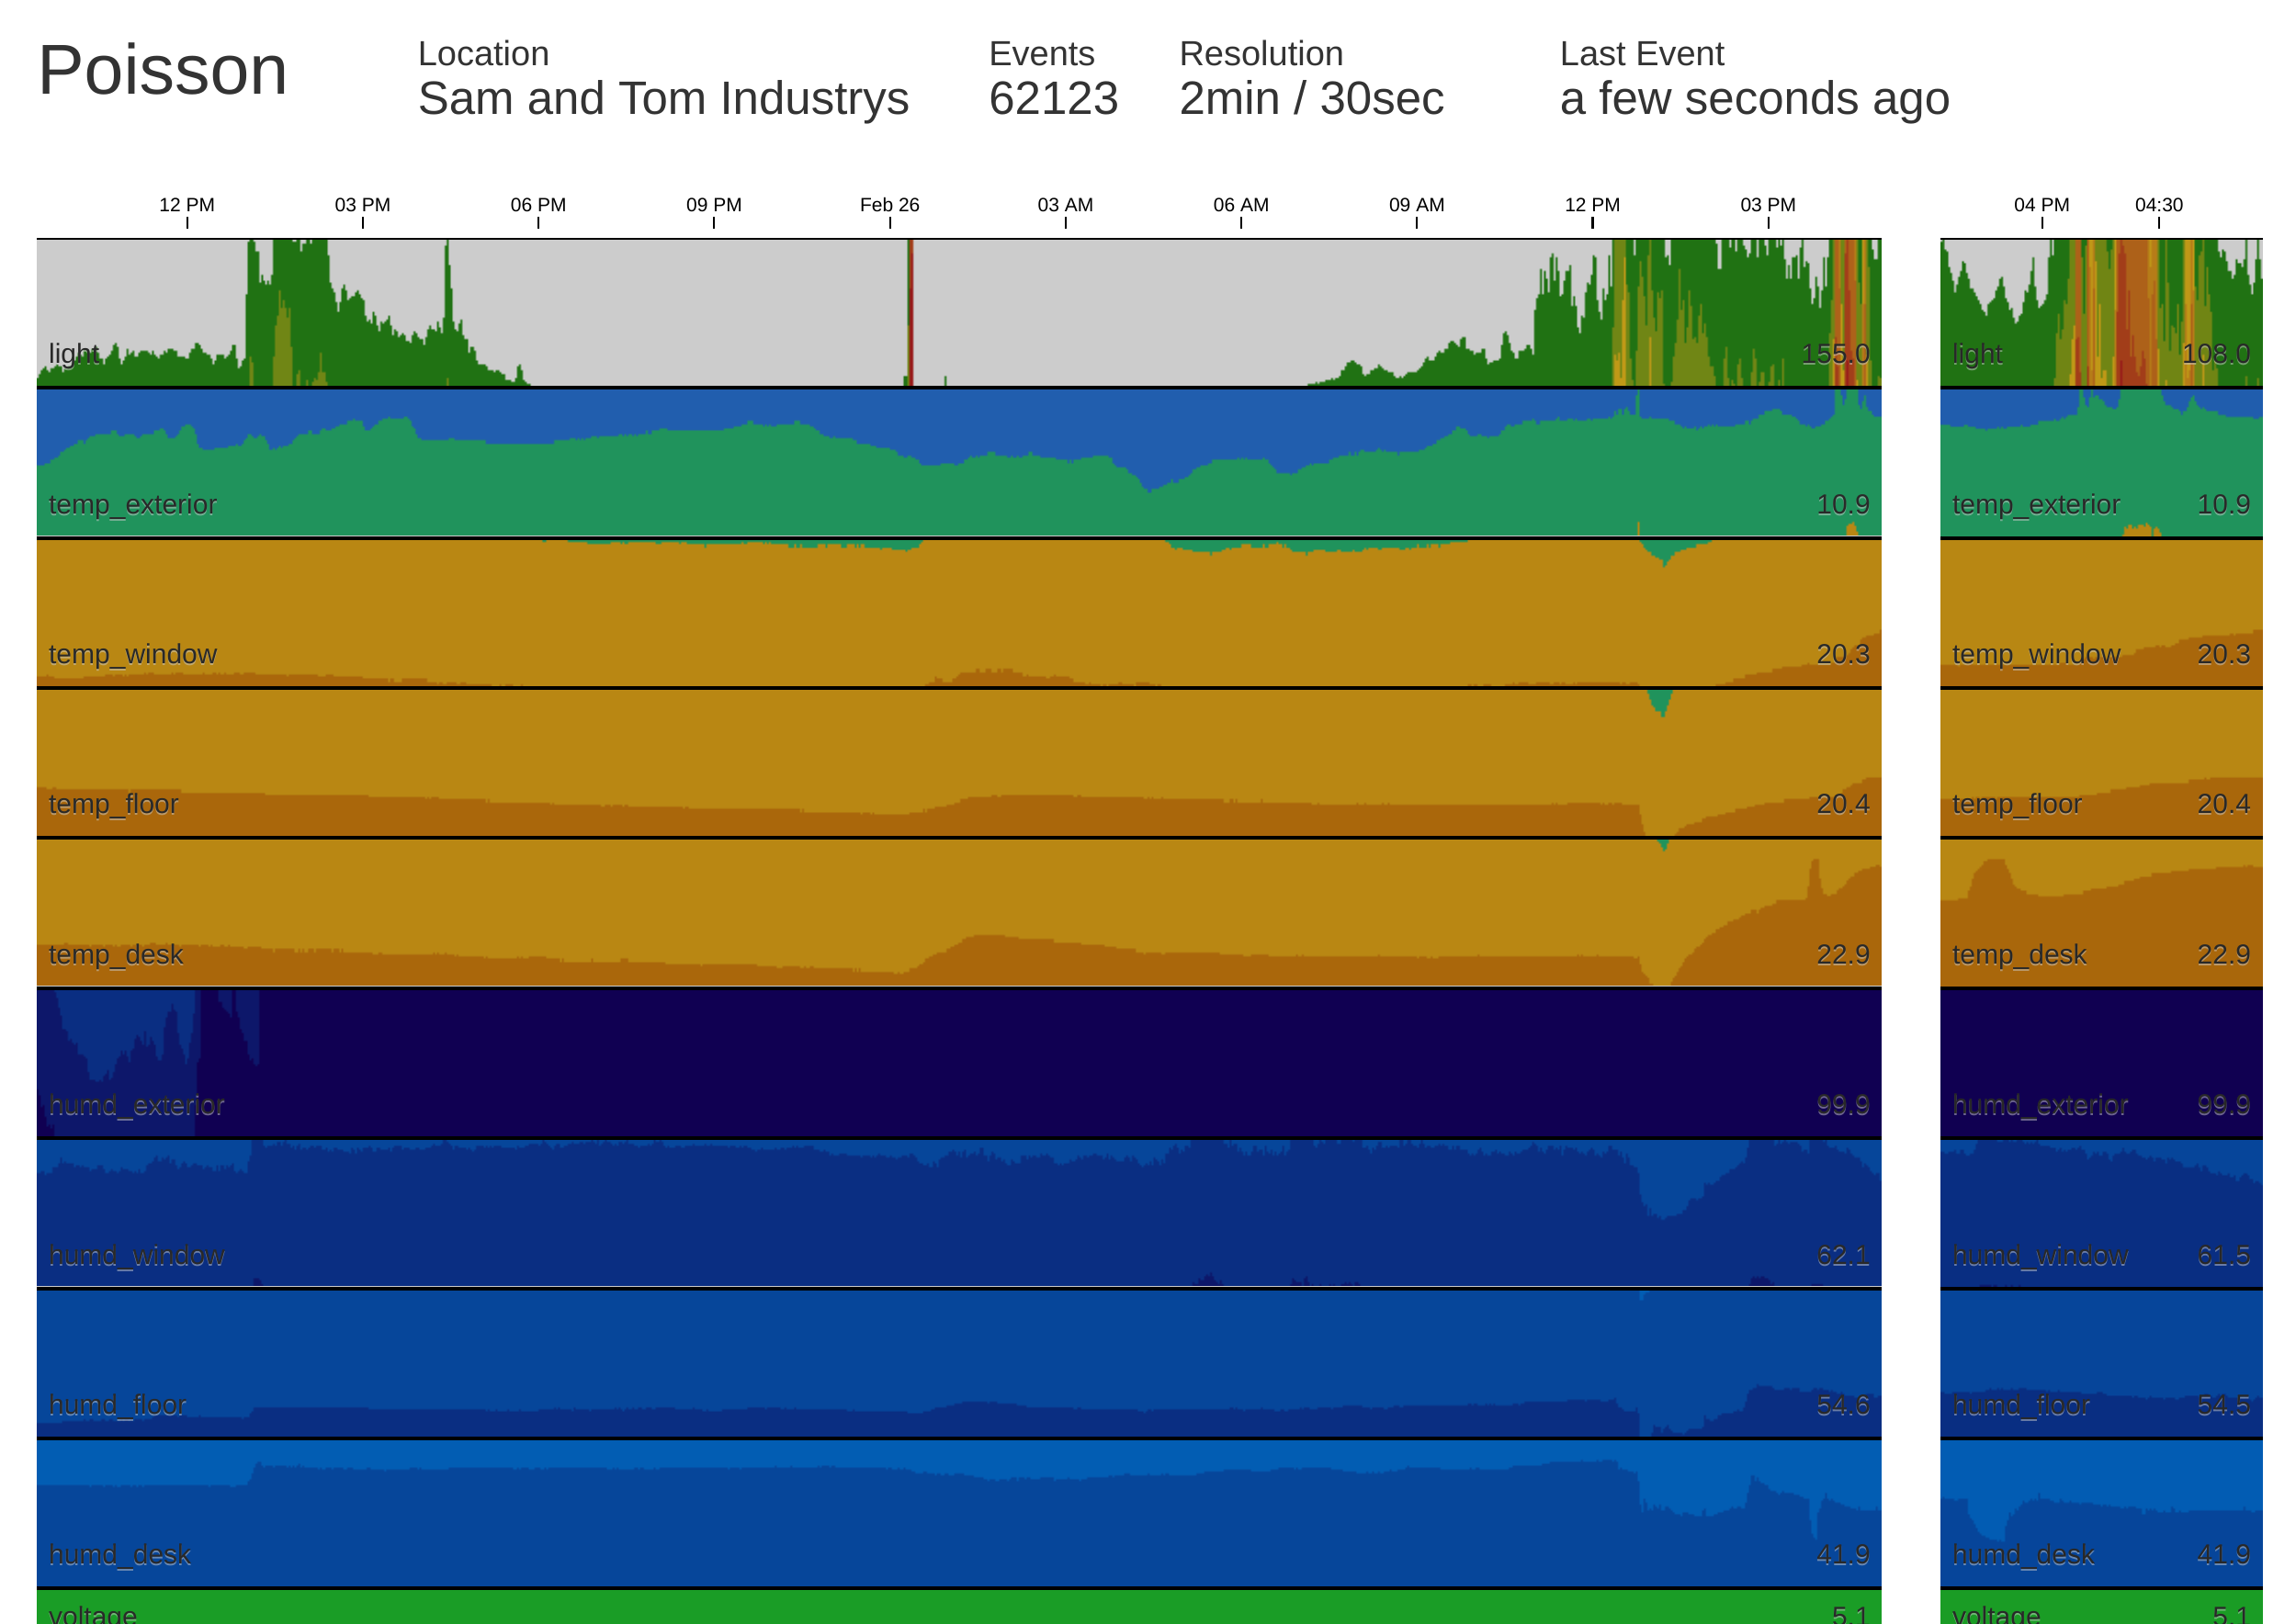
We have established end-to-end communications and confirmed that sensor data can find its way to a test server hosted on the local network. The final piece of the puzzle was to throw up a website designed to receive, store and present the data. Somewhat fortuitously, a project that I had begun and abandoned in 2014 seemed to fit the bill: Poisson, a flask-fronted, redis-backed, schema-less monitoring system. Despite not looking at it in almost three years, I felt there might be some mileage in revising it for our purpose.
Initially Poisson was designed to monitor the occurrence of arbitrary events, referred to by a key. A GET request with a key, would cause Poisson to add a timestamped entry to the redis database for that key. For example, one could count occurrences of passengers, customers, sales or other time sensitive events by emitting GET requests with a shared key to the Poisson server. The goal was to generate interesting Poisson distribution statistics from the timestamped data, but I never get as far as the fun mathematics. The front end made use of the hip-at-the-time socket.io framework, capable of pushing newly detected events in real time to connected clients, and drawing some pretty pretty graphs using d3 and cubism.
After some quick tweaks that allowed requests to also specify a value for the latest event (instead of assuming 1) and provided an API endpoint for POST requests that wrapped the mechanism of the original GET for each key:value pair in the JSON data, we were ready to go.
Until I discovered all this newfangled websocket nonsense didn’t seem to play well with apache in practice. After much frustration, the best solution appeared to involve installing gevent with pip on the server, which according to the flask-socketio documentation for deployment would cause flask-socketio to replace the development server (typically inappropriate for production use) with an embedded server capable of working in prod. I could then invoke the application myself to bind it to some local port. After some fiddling, I found the following two lines in my apache config were all that was needed to correctly proxy the locally-run Poisson application to my existing webserver.
ProxyPass http://localhost:5000/
ProxyPassReverse  http://localhost:5000/
Testing the Prototypes (not in a hive)
Clearly we’re not hive ready. We’ve planted the current version of the hardware at Tom’s house (to avoid having to deal with getting the ESP8266 to work with eduroam‘s 802.1x authentication) and had the server running long enough to collect over 100,000 events and iron out any small issues. We’re currently polling approximately every 30 seconds, and the corresponding deployment of the Poisson interface is configured to show over 24 hours of data at a resolution of 2 minutes, and the past 90 minutes at a resolution of 30 seconds.
All in all I’m pretty pleased with what we’ve managed to accomplish in around two days of half baked work, and the interface is probably the shiniest piece of web I’ve had the displeasure of making since Triage.
Conclusion
We’ve collected over 100,000 events with little issue. I’ve ordered some additional sensors of interest, on the way are some sound sensors, and infrared sensors. The latter I shall be using in an attempt to count (or at least monitor) bee in/out activity at the hive entrance.
It won’t be until nearer the middle-to-end of March that the weather will likely pick up enough to mess around with the hive at length. Though we must bee proof the sensors and construct a weather proof box for the transmitting Moteino before then. You can also look at the microcontroller code in our Telehive repository, and the Poisson flask application repository.
In the meantime, go spy on Tom’s flat live.
tl;dr
- Moteinos are awesome, low power radio communications are cool
- The Arduino IDE can be a monumental pain in the ass sometimes
- We had to manually uncomment lines in the headers for the
ESP8266HTTPClientlibrary to enable debugging, we still cannot fathom why - You need to specify the SHA1 fingerprint of your remote server as a second parameter to
http.beginif you want to use HTTPS withESP8266HTTPClient - Your crap Python test server should set the headers for its response, else your
ESP8266HTTPClientconnection will think it has failed ESP8266HTTPClientuses its own response codes that are#define‘d in its headers, not regular HTTP codesuint8_t‘s are packed with 3 bytes to align them on the NodeMCU ESP8266 architecture- This kind of stuff continues to be fraught with frustration, but is rather rewarding when it all comes together
If you just want to know what happened without the flair, skip to the timeline.
Earlier this afternoon, my server was upset. At 15:57, a duo of IP addresses begun making rapid and repeated POST requests to an auxiliary component of WordPress, forcing apache to begin consuming significant amounts of system memory. Disappointingly this went undetected, and less than half an hour later, at 16:24, the system ran out of memory, invoked the OOM killer and terminated mysqld. Thus at 16:24, denial of service to all applications requiring access to a database was successful.
Although the server dutifully restarted mysqld less than a minute later, the attack continued. Access to apache was denied intermittently (by virtue of the number of requests) and the OOM killer terminated mysqld again at 16:35. The database server daemon was respawned once more, only to be killed just short of half an hour later at 17:03.
It wasn’t until 17:13 that I was notified of an issue, by means of a Linode anomaly notification, disk I/O had been unusually high for a two hour period. I was away from my terminal but used my phone to check my netdata instance. Indeed I could confirm a spike in disk activity but it appeared to have subsided. I had run some scripts and updates (which can occasionally trigger these notifications) in the previous two hours so assumed causation and dismissed the notification. Retrospectively, it would be a good idea to have some sort of check list to run through upon receipt of such a message, even if the cause seems obvious.
The attack continued for the next hour and a half, maintaining denial of the mysqld service (despite the respawner’s best effort), at 18:35 (two and a half hours after the attack began) I returned from the field to my terminal and decided to double check the origin of the high disk I/O. I loaded the netdata visualiser (apache seemed to be responsive) and load seemed a little higher than usual. Disk I/O was actually higher than usual, too. It would seem that I had become a victim of y-axis scaling; the spike I had dismissed as a one-off burst in activity earlier had masked the increase in average disk I/O. Something was happening.
I checked system memory, we were bursting at the seams. The apache process was battling to consume as much memory on the system as possible. mysqld appeared to be in a state of flux, so I tried to reach database backed applications; Phabricator, and my blog – both returned some form of upset “where is my database” response. I opened the syslog and searched for evidence that the out of memory killer had been swinging its hammer. At this point I realised this was a denial of service.
I located the source of the high disk I/O when I opened the apache access log. My terminal spewed information on POST requests to xmlrpc.php aimed at two WordPress sites hosted on my server. I immediately added iptables rules for both IP addresses, and two different IPs from the same block took over the attack. I checked the whois and discovered all the origin IPs were in the same assigned /24 block, so I updated iptables with a rule to drop traffic from the whole block. The requests stopped and I restarted the seemingly mangled mysqld process.
I suspect the attack was not aimed at us particularly, but rather the result of a scan for WordPress sites (I am leaning towards for the purpose of spamming). However I was disappointed in my opsec-fu, not only did I prevent this from happening, but I failed to stop it happening for over two hours. I was running OSSEC, but any useful notifications failed to arrive in time as I had configured messages to be sent to a non-primary address that GMail must poll from intermittently. A level 12 notification was sent 28 minutes after the attack started as soon as the OOM was invoked for the first time, but the message was not pulled to my inbox until after the attack had been stopped.
The level of traffic was certainly abnormal and I was also frustrated that I had not considered configuring fail2ban or iptables to try and catch these sort of extreme cases. Admittedly, I had dabbled in this previously, but struggled to strike a balance with iptables that did not accidentally ban false positives attempting to use a client’s web application. Wanting to combat this happening in future, I set about to implement some mitigations:
Mitigation Implementation
Configure a crude fail2ban jail for apache DOS defence
My first instinct was to prevent ridiculous numbers of requests to apache from the same IP being permitted in future. Naturally I wanted to tie this into fail2ban, the daemon I use to block access to ssh, the mail servers, WordPress administration, and such. I found a widely distributed jail configuration for this purpose online but it did not work; it didn’t find any hosts to block. The hint is in the following error from fail2ban.log when reloading the service:
fail2ban.jail   : INFO   Creating new jail 'http-get-dos'
...
fail2ban.filter : ERROR  No 'host' group in '^ -.*GET'
The regular expression provided by the filter (failregex) didn’t have a ‘host’ group to collect the source IP with, so although fail2ban was capable of processing the apache access.log for lines containing GET requests, all the events were discarded. This is somewhat unfortunate considering the prevalence of the script (perhaps it was not intended for the combined_vhost formatted log, I don’t know). I cheated and added a CustomLog to my apache configuration to make parsing simple whilst also avoiding interference with the LogFormat of the prime access.log (whose format is probably expected to be the default by other tooling):
LogFormat "%t [%v:%p] [client %h] \"%r\" %>s %b \"%{User-Agent}i\"" custom_vhost
CustomLog ${APACHE_LOG_DIR}/custom_access.log custom_vhost
The LogFormat for the CustomLog above encapsulates the source IP in the same manner as the default apache error.log, with square brackets and the word “client”. I updated my http-get-dos.conf file to provide a host group to capture IPs as below (I’ve provided the relevant lines from jail.local for completeness):
I tested the configuration with fail2ban-regex to confirm that IP addresses were now successfully captured:
$ fail2ban-regex /var/log/apache2/custom_access.log /etc/fail2ban/filter.d/http-get-dos.conf
[...]
Failregex
|- Regular expressions:
|  [1] \[[^]]+\] \[.*\] \[client <HOST>\] "GET .*
|
`- Number of matches:
   [1] 231 match(es)
[...]
It works! However when I restarted fail2ban, I encountered an issue whereby clients were almost instantly banned when making only a handful of requests, which leads me to…
How to badly configure fail2ban
This took some time to track down, but I had the feeling that for some reason my jail.conf was not correctly overriding maxretry – the number of times an event can occur before the jail action is applied, which by default is 3. I confirmed this by checking the fail2ban.log when restarting the service:
fail2ban.jail   : INFO   Creating new jail 'http-get-dos'
...
fail2ban.filter : INFO   Set maxRetry = 3
Turns out, the version of the http-get-conf jail I had copied from the internet into my jail.conf was an invalid configuration. fail2ban relies on the Python ConfigParser which does not support use of the # character for an in-line comment. Thus lines such as the following are ignored (and the default is applied instead):
maxretry = 600 # 600 attempts in
findtime = 30  # 30 seconds (or less)
Removing the offending comments (or switching them to correctly-styled inline comments with ‘;’) fixed the situation immediately. I must admit this had me stumped and seems pretty counter-intuitive especially as fail2ban doesn’t offer a warning or such on startup either. But indeed, it appears in the documentation, so RTFM, kids.
Note that my jail.local above has a jail for http-post-dos, too. The http-post-dos.conf is exactly the same as the GET counterpart, just the word GET is replaced with POST (who’d’ve thought). I’ve kept them separate as it means I can apply different rules (maxretry and findtime) to GET and POST requests. Note too, that even if I had been using http-get-dos today, this wouldn’t have saved me from denial of service, as the requests were POSTs!
Relay access denied when sending OSSEC notifications
As mentioned, OSSEC was capable of sending notifications but they were not delivered until it was far too late. I altered the global ossec.conf to set the email_to field to something more suitable, but when I tested a notification, it was not received. When I checked the ossec.log, I found the following error:
ossec-maild(1223): ERROR: Error Sending email to xxx.xxx.xxx.xxx (smtp server)
I fiddled some more and in my confounding, located some Relay access denied errors from postfix in the mail.log. Various searches told me to update my postfix main.cf with a key that is not used for my version of postfix. This was not particularly helpful advice, but I figured from the ossec-maild error above that OSSEC must be going out to the internet and back to reach my SMTP server and external entities must be authorised correctly to send mail in this way. To fix this, I just updated the smtp_server value in the global OSSEC configuration to localhost:
<ossec_config>
  <global>
    <email_notification>yes</email_notification>
    <email_to>[email protected]</email_to>
    <smtp_server>localhost</smtp_server>
    <email_from>[email protected]</email_from>
  </global>
...
Deny traffic to xmlrpc.php entirely
WordPress provides an auxiliary script, xmlrpc.php which allows external entities to contact your WordPress instance over the XML-RPC protocol. This is typically used for processing pingbacks (a feature of WordPress where one blog can notify another that one of its posts has been mentioned), via the XML-RPC pingback API, but the script also supports a WordPress API that can be used to create new posts and the like. For me, I don’t particularly care about pingback notifications and so can mitigate this attack in future entirely by denying access to the file in question in the apache VirtualHost in question:
<VirtualHost>
...
    <files xmlrpc.php>
        order allow,deny
        deny from all
    </files>
</VirtualHost>
tl;dr
Timeline
1557 (+0'00"): POSTs aimed atxmlrpc.phpfor two WordPressVirtualHostbegin1624 (+0'27"):mysqldterminated by OOM killer1625 (+0'28"):OSSECLevel 12 Notification sent1625 (+0'28"):mysqldrespawns but attack persists1635 (+0'38"):mysqldterminated by OOM killer1636 (+0'39"):mysqldrespawns1700 (+1'03"):OSSECLevel 12 Notification sent1703 (+1'06"):mysqldterminated by OOM killer1713 (+1'16"): Disk IO 2-Hour anomaly notification sent from Linode1713 (+1'16"): Linode notificationX-Receivedand acknowledged by out of office sysop1835 (+2'38"): Sysop login,netdataaccessed1837 (+2'40"):mysqldterminated by OOM killer, error during respawn1839 (+2'42"):iptablesupdated to drop traffic from IPs, attack is halted briefly1840 (+2'43"): Attack continues from new IP,iptablesupdated to drop traffic from block1841 (+2'44"): Attack halted, load returns to normal,mysqldservice restarted1842 (+2'45"): AllOSSECnotificationsX-Receivedafter poll from server
Attacker
POSTrequests originate from IPs in an assigned/24blockwhoisrecord served by LACNIC (Latin America and Caribbean NIC)- Owner company appears to be an “Offshore VPS Provider”
- Owner address and phone number based in Seychelles
- Owner website served via CloudFlare
- GeoIP database places attacker addresses in Chile (or Moscow)
tracerouteshows the connection is located in Amsterdam (10ms away fromvlan3557.bb1.ams2.nl.m24) – this is particularly amusing considering thewhoisowner is an “offshore VPS provider”, though it could easily be tunneled via Amsterdam
Suspected Purpose
- Spam: Attacker potentially attempting to create false pingbacks (to link to their websites) or forge posts on the WordPress blogs in question
- Scan hit-and-run: Scan yielded two
xmlrpc.phpendpoints that could be abused for automatic DOS
Impact
- Intermittent
apachestability for ~3 hours - Full service denial of
mysqlfor ~2.25 hours - Intermittent disruption to email for ~2 hours
Failures
- No monitoring or responsive control configured for high levels of requests to
apache OSSECconfigured to deliver notifications to non-primary address causing messages that would have prompted action much sooner to not arrive within actionable timeframe- Failed to recognise (or consider) disk I/O anomaly message as a red herring for something more serious
- Forgetting that the attack surface for WordPress is always bigger than you think
Positives
- Recently installed
netdatainstance immediately helped narrow the cause down toapachebased activity - Attack mitigated in less than five minutes once I actually got to my desk
Mitigations
OSSECreconfigured to send notifications to an account that does not need to poll from POP3 intermittently- Added simple
GETandPOSTjails tofail2banconfiguration to try and mitigate such attacks automatically in future - Drop traffic to offending WordPress script to reduce attack surface
- Develop a check list to be followed after receipt of an anomaly notification
- Develop a healthy paranoia against people who are out to get you and be inside your computer (or make it fall over)
- Moan about WordPress
Mitigation Tips and Gotcha’s
- Set your
OSSECnotificationsmtp_servertolocalhostto bypassrelay access deniederrors - Make use of
fail2ban-regex <log> <filter>to test your jails - NEVER use
#for inline comments infail2banconfigurations, the entire line is ignored - If you are protecting yourself from
GETattacks, have you forgottenPOST?