In this somewhat long and long overdue post; I’ll attempt to explain the work done so far and an overview of the many issues encountered along the way and an insight in to why doing science is much harder than it ought to be.
In the beginning…
To address my lack of experience in handling metagenomic data, I was given a small1 dataset to play with. Immediately I had to adjust my interpretation of what constitutes a “small” file. Previously the largest single input I’ve had to work with would probably have been the human reference genome (GRCh37) which as a FASTA2 file clocks in at around a little over 3GB3.
Thus imagine my dismay when I am directed to the directory of my input data and find 2x42GB file.
Together, the files are 28x the size of the largest file I’ve ever worked with…
So, what is it?
Size aside, what are we even looking at and how is there so much of it?
The files represent approximately 195 million read pairs from a nextgen4 sequencing run, with each file holding each half of the pair in the FASTQ format. The dataset is from a previous IBERS PhD student and was introduced in a 2014 paper titled Metaphylogenomic and potential functionality of the limpet Patella pellucida’s gastrointestinal tract microbiome [PubMed]. According to the paper over 100 Blue-rayed Limpets (Patella pellucida) were collected from the shore of Aberystwyth and placed in to tanks to graze on Oarweed (Laminaria digitata) for one month. 60 were plated, anesthetized and aseptically dissected; vortexing and homogenizing the extracted digestion tracts before repeated filtering and final centrifugation to concentrate cells as a pellet. The pellets were then resuspended and DNA was extracted with a soil kit to create an Illumina paired-end library.
The paper describes the post-sequencing data handling briefly: the net result of 398 million reads were quality processed using fastq-mcf; to remove adaptor sequences, reads with quality lower than Q20 and reads shorter than 31bp. The first 15bp of each read were also truncated5. It was noted the remaining 391 million reads were heavily contaminated with host-derived sequences and thus insufficient for functional analysis.
My job was to investigate to what extent the contamination had occurred and to investigate whether any non-limpet reads could be salvaged for functional analysis.
Let’s take a closer look at the format to see what we’re dealing with.
FASTQ Format
FASTQ is another text based file format, similar to FASTA but also stores quality scores for each nucleotide in a sequence. Headers are demarcated by the @ character instead of > and although not required tend to be formatted strings containing information pertaining to the sequencing device that produced the read. Sequence data is followed by a single + on a new line, before a string of quality scores (encoded as ASCII characters within a certain range, depending on the quality schema used) follows on another new line:
|
1 2 3 4 5 |
@BEEPBOOP-SEQUENCER:RUN:CELL:LANE:TILE:X:Y 1:FILTERED:CONTROL:INDEX HELLOIAMASEQUENCEMAKEMEINTOAPROTEINPLEASES + !"#$%&'()*+,-./0123456789:;<=>?@ABCDEFGHIJ |
This example uses Illumina 1.8+ sequence identifiers and quality scores, the same as those found in the dataset. The quality string represents increasing quality from 0 (worst) to 41 (best) left to right. Taking the first read from the first file as an actual example, we get a better look at a “real-world” sequence header:
|
1 2 3 4 5 |
@HWI-D00173:21:D22FBACXX:5:1101:1806:1986 1:N:0:CTCTCT TTGTGTCAAAACCGAACAACATGACAATCTTACTTGCCTGGCCCTCCGTCCTGCACTTCTGGCATGGGGAAACCACACTGGGGGC + IIIAEGIIIFIIIEGIFFIIIFIFIIEFIIIIEFIIEFGCDEFFFFABDDCCCCCBBBBBBBBBBBBBB?BBBB@B?BBBBBBB5 |
So how are these files so large6? Given each read record takes four lines (assuming reads short enough to not be spead over multiple lines — which they are not in our case) and each file contains around 195 million reads, we’re looking at 780 million lines. Per file.
The maximum sequence size was 86bp and each base takes one byte to store, as well as corresponding per-base quality information:
|
1 2 3 |
86 * 2 * 195000000 > 33540000000B == 33.54GB |
Allowing some arbitrary number of bytes for headers and the + characters:
|
1 2 3 |
((86 * 2) + 50 + 1) * 195000000 > 43485000000B == 43.49GB |
It just adds up. To be exact, both input files span 781,860,356 lines each — meaning around 781MB of storage is used merely for newlines alone! It takes wc 90 seconds to just count lines, these files aren’t small at all!
Quality Control
Although already done (as described by the paper), it’s good to get an idea of how to run and interpret basic quality checks on the input data. I used FASTQC which outputs some nice HTML reports that can be archived somewhere if you are nice and organised.
Shit happens. Well, it’s good you’re checking, I’m much less organised.
For an input FASTQ file, FASTQC generate a summary metrics table. I’ve joined the two tables generated for my datasets below.
| Measure | Value (_1) | Value (_2) |
|---|---|---|
| Filename | A3limpetMetaCleaned_1.fastq.trim | A3limpetMetaCleaned_2.fastq.trim |
| File type | Conventional base calls | Conventional base calls |
| Encoding | Sanger / Illumina 1.9 | Sanger / Illumina 1.9 |
| Total Sequences | 195465089 | 195465089 |
| Filtered Sequences | 0 | 0 |
| Sequence length | 4-86 | 16-86 |
| %GC | 37 | 37 |
Here I managed to miss two things:
- Both files store the same number of sequences (which is expected as the sequences are paired), something that I apparently forget about shortly…
- Both files do not contain sequences of uniform length, neither do the non-uniform lengths have the same range, meaning that some pairs will not align to correctly as they cannot overlap fully…
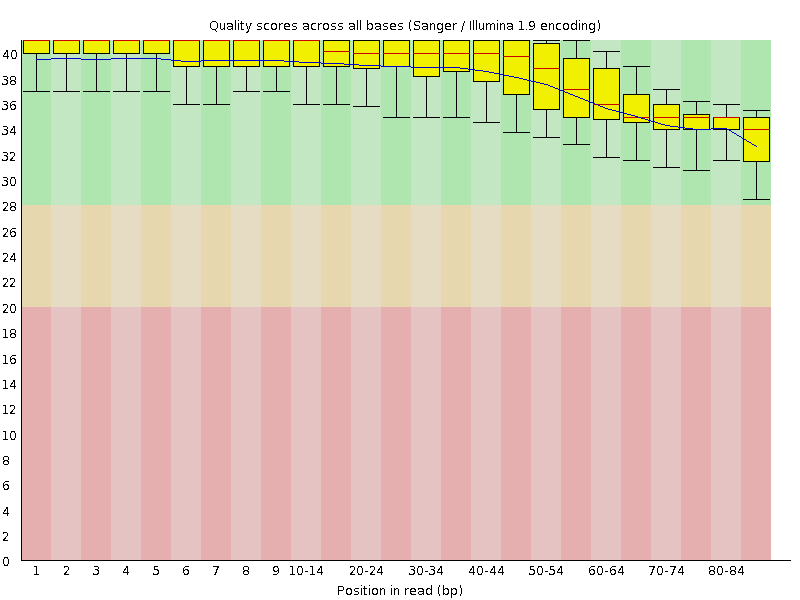
FASTQC also generates some nice graphs, of primary interest, per-base sequence quality over the length of a read:
| A3limpetMetaCleaned_1.fastq.trim | A3limpetMetaCleaned_2.fastq.trim |
|---|---|
 |
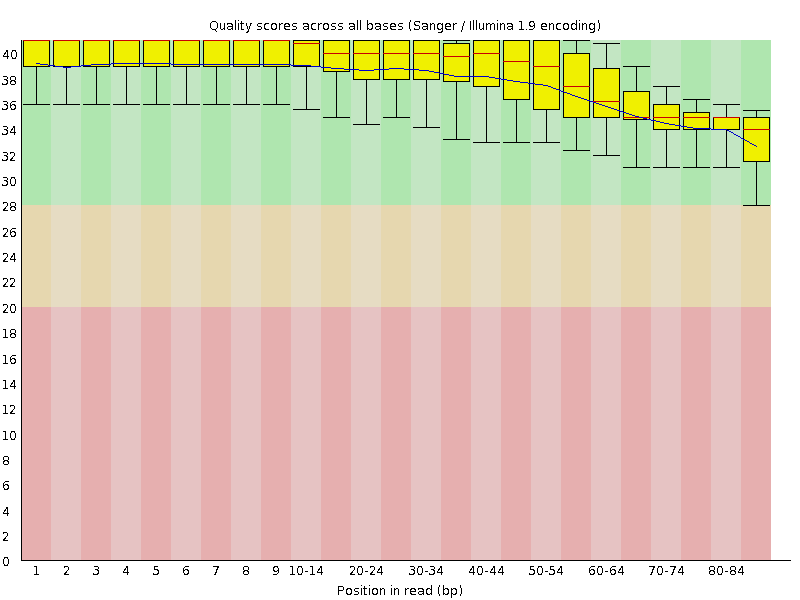 |
Although made small to fit, both box plots clearly demonstrate that average base quality (blue line) lives well within the “green zone” (binning scores of 28+) slowly declining to a low of around Q34. This is a decent result, although not surprising considering quality filtering has already been performed on the dataset to remove poor quality reads! A nice sanity check nonetheless. I should add that it is both normal and expected for average per-base quality to fall over the length of a read (though this can be problematic if the quality falls drastically) by virtue of the unstable chemistry involved in sequencing.
FASTQC can plot a distribution of GC content against a hypothetical normal distribution, this is useful for genomic sequencing where one would expect such a distribution. However a metagenomic sample will (should) contain many species that may have differing distributions of GC content across their invididual genomes. FASTQC will often raise a warning about the distribution of GC content for such metagenomic samples given a statistically significant deviation from or violation of the theoretical normal. These can be ignored.
Two other tests also typically attract warnings or errors; K-mer content and sequence duplication levels. These tests attempt to quantify the diversity of the reads at hand, which is great when you are looking for diversity within reads of one genome; raising a flag if perhaps you’ve accidentally sequenced all your barcodes or done too many rounds of PCR and been left with a lot of similar looking fragments. But once again, metagenomics violates expectations and assumptions made by traditional single-species genomics. For example, highly represented species ([and|or] fragments that do well under PCR) will dominate samples and trigger apparently high levels of sequence duplication. Especially so if many species share many similar sequences which is likely in environments undergoing co-evolution.
FASTQC also plots N count (no call), GC ratio and average quality scores across whole reads as well as per-base sequence content (which should be checked for a roughly linear stability) and distribution of sequence lengths (which should be checked to ensure the majority of sequences are a reasonable size). Together a quick look at all these metrics should provide a decent health check before moving forward, but they too should be taken with a pinch of salt as FASTQC tries to help you answer the question “are these probably from one genome?”.
Trimming
Trimming is the process of truncating bases that fall below a particular quality threshold at the start and end of reads. Typically this is done to create “better” read overlaps (as potential low-quality base calls could otherwise prevent overlaps that should exist) which can help improve performance of downstream tools such as assemblers and aligners.
Trimming had already been completed by the time I had got hold of the dataset7, but I wanted to perform a quick sanity check and ensure that the two files had been handled correctly8. Blatantly forgetting about and ignoring the FASTQC reports I had generated and checked over, I queried both files with grep:
|
1 2 |
grep -c '^@' $FILE |
|
1 2 3 |
196517718 A3limpetMetaCleaned_1.fastq.trim 196795722 A3limpetMetaCleaned_2.fastq.trim |
“Oh dear”9, I thought. The number of sequences in both files are not equal. “Somebody bumbled the trimming!”. I hypothesised that low-quality sequences had been removed but the corresponding mate in the other file had not been removed to keep the pairs in sync.
With hindsight, let’s take another look at the valid range of quality score characters for the Illumina 1.8+ format:
|
1 2 3 4 |
!"#$%&'()*+,-./0123456789:;<=>?@ABCDEFGHIJ ^ ^ ^ 0..............................31........41 |
The record delimiting character; @ is used to encode Q31. For some reason somebody thought it would be a great idea to make this character available for use in quality strings. I’d been counting records as well as any quality line that happened to begin with an encoded score of Q31, the @.
@samstudio8 One of many sins in FASTQ story. They could have used tilde at top of ASCII range or something… see also http://t.co/x2Jz2owODp
— Peter Cock (@pjacock) January 4, 2015
And so, I unnecessarily launched myself head first in to my first large scale computing problem; given two sets of ~196 million reads which mostly overlap, how can we efficiently find the intersection (and write it to disk)?
tl;dr
- In bioinformatics, “small” really isn’t small.
- Try to actually read quality reports, then read them again. Then grab a coffee or go outside and come back and read them for a third time before you do something foolish and have to tell everyone at your lab meeting about how silly you are.
- Don’t count the number of sequences in a FASTQ file by counting
@characters at the start of a line, it’s a valid quality score for most quality encoding formats.
- Now realised to be a complete misnomer, both in terms of size and effort. ↩
-
A text based file format where sequences are delimited by
>and a sequence name [and|or] description, followed by any number of lines containing nucleotides or amino acids (or in reality, whatever you fancy):1234567>Example Sequence Hoot Factor 9 | 00000001HELLOIAMASEQUENCEBEEPBOOPTRANSLATEMEINTOPROTEINS>Example Sequence Hoot Factor 9 | 00000002NNNNNNNNNNNNNNNNNTypically sequence lines are of uniform length (under 80bp), though this is not a requirement of the format. The NCBI suggest formats for the header (single line descriptor, following the
>character) though these are also not required to be syntactically valid. ↩ - Stored as text we take a byte for each of the 3 billion nucleotides as well as each newline delimiter and an arbitrary number of bytes for each chromosome’s single line header. ↩
- Seriously, can we stop calling it nextgen yet? ↩
-
I’m unsure why, from a recent internal talk I was under the impression we’d normally trim the first “few” bases (1-3bp, maybe up to 13bp if there’s a lot of poor quality nucleotides) to try and improve downstream analysis such as alignments (given the start and end of reads can often be quite poor and not align as well as they should) but 15bp seems excessive. It also appears the ends of the reads were not truncated.
The ends of the reads were not truncated as the quality falls inside a reasonable threshold.
↩ - Or small, depending on whether you’ve adjusted your world view yet. ↩
-
I’m unsure why, from a recent internal talk I was under the impression we’d normally trim the first “few” bases (1-3bp, maybe up to 13bp if there’s a lot of poor quality nucleotides) to try and improve downstream analysis such as alignments (given the start and end of reads can often be quite poor and not align as well as they should) but 15bp seems excessive. It also appears the ends of the reads were not truncated.
The ends of the reads were not truncated as the quality falls inside a reasonable threshold.
↩ - Primarily because I don’t trust anyone. Including myself.[^me] ↩
- I’m sure you can imagine what I really said. ↩