Once again, I have adequately confounded progress since my last report to both myself, and my supervisorial team such that it must be outlaid here. Since I’ve got back from having a lovely time away from bioinformatics, the focus has been to build on top of our highly shared but unfortunately rejected pre-print: Advances in the recovery of haplotypes from the metagenome.
I’d hoped to have a new-and-improved draft ready by Christmas, in time for an invited talk at Oxford, but sadly I’ve had to postpone both. Admittedly, it has taken quite some time for me to dust myself down after having the entire premise of my PhD so far rejected without re-submission, but I have finally built up the motivation to revisit what is quite a mammoth piece of work, and am hopeful that I can take some of the feedback on board to rein in the new year with an even better paper.
This will likely be the final update of the year.
This is also the last Christmas I hope to be a PhD candidate.
The adventure continues…
We left off with a lengthy introduction to my novel data structure; Hansel and algorithm; Gretel. In that post I briefly described some of the core concepts of my approach, such as how the Hansel matrix is reweighted after Gretel successfully creates a path (haplotype), how we automatically select a suitable value for the “lookback” parameter (i.e. the order of the Markov chain used when calculating probabilities for the next variant of a haplotype), and the current strategy for smoothing.
In particular, I described our current testing methodologies. In the absence of metagenomic data sets with known haplotypes, I improvised two strategies:
- Trivial Haplomes (Triviomes)
Data sets designed to be finely controlled, and well-defined. Short, random haplotypes and sets of reads are generated. We also generate the alignment and variant calls automatically to eliminate noise arising from the biases of external tools. These data sets are not expected to be indicative of performance on actual sequence data, but rather represent a platform on which we can test some of the limitations of the approach. -
Synthetic Metahaplomes
Designed to be more representative of the problem, we generate synthetic reads from a set of similar genes. The goal is to recover the known input genes, from an alignment of their reads against a pseudo-reference.
I felt our reviewers misunderstood both the purpose and results of the “triviomes”. In retrospect, this was probably due to the (albeit intentional) lack of any biological grounding distracting readers from the story at hand. The trivial haplotypes were randomly generated, such that none of them had any shared phylogeny. Every position across those haplotypes was deemed a SNP, and were often tetra-allelic. The idea behind this was to cut out the intermediate stage of needing to remove homogeneous positions across the haplotypes (or in fact, from even having to generate haplotypes that had homogeneous positions). Generated reads were thus seemingly unrealistic, at a length of 3-5bp. However they meant to represent not a 3-5bp piece of sequence, but the 3-5bp sequence that remains when one only considers genomic positions with variation, i.e. our reads were simulated such they spanned between 3 and 5 SNPs of our generated haplotypes.
I believe these confusing properties and their justifications got in the way of expressing their purpose, which was not to emulate the real metahaplotying problem, but to introduce some of the concepts and limitations of our approach in a controlled environment.
Additionally, our reviewers argued that the paper is lacking an extension to the evaluation of synthetic metahaplomes: data sets that contain real sequencing reads. Indeed, I felt that this was probably the largest weakness of my own paper, especially as it would not require an annotated metagenome. Though, I had purposefully stayed on the periphery of simulating a “proper” metagenome, as there are ongoing arguments in the literature as to the correct methodology and I wanted to avoid the simulation itself being used against our work. That said, it would be prudent to at least present small synthetic metahaplomes akin to the DHFR and AIMP1, using real reads.
So this leaves us with a few major plot points to work on before I can peddle the paper elsewhere:
- Improve TriviomesWe are already doing something interesting and novel, but the “triviomes” are evidently convoluting the explanation. We need something with more biological grounding such that we don’t need to spend many paragraphs explaining why we’ve made certain simplifications, or cause readers to question why we are doing things in a particular way. Note this new method will still need to give us a controlled environment to test the limitations of
HanselandGretel. - Polish DHFR and AIMP1 analysis
One of our reviewers misinterpreted some of the results, and drew a negative conclusion aboutGretel‘s overall accuracy. I’d like to revisit the *DHFR* and *AIMP1* data sets to both improve the story we tell, but also to describe in more detail (with more experiments) under what conditions we can and cannot recover haplotypes accurately. - Real Reads
Create and analyse a data set consisting of real reads.
The remainder of this post will focus on the first point, because otherwise no-one will read it.
Triviomes and Treeviomes
After a discussion about how my Triviomes did not pay off, where I believe I likened them to “random garbage”. It was clear that we needed a different tactic to introduce this work. Ideally this would be something simple enough that we could still have total control over both the metahaplome to be recovered, and the reads to recover it from, but also yield a simpler explanation for our readers.
My biology-sided supervisor, Chris, is an evolutionary biologist with a fetish for trees. Throughout my PhD so far, I have managed to steer away from phylogenetic trees and the like, especially after my terrifying first year foray into taxonomy, where I discovered that not only can nobody agree on what anything is, or where it should go, but there are many ways to skin a cat draw a tree.
Previously, I presented the aggregated recovery rates of randomly generated metahaplomes, for a series of experiments, where I varied the number of haplotypes, and their length. Remember that every position of these generated haplotypes was a variant. Thus, one may argue that the length of these random haplotypes was a poor proxy for genetic diversity. That is, we increased the number of variants (by making longer haplotypes) to artificially increase the level of diversity in the random metahaplome, and make recoveries more difficult. Chris pointed out that actually, we could specify and fix the level of diversity, and generate our haplotypes according to some… tree.
This seemed like an annoyingly neat and tidy solution to my problem. Biologically speaking, this is a much easier explanation to readers; our sequences will have meaning, our reads will look somewhat more realistic and most importantly, the recovery goal is all the more tangible. Yet at the same time, we still have precise control over the tree, and we can generate the synthetic reads in exactly the same way as before, allowing us to maintain tight control of their attributes. So, despite my aversion to anything that remotely resembles a dendrogram, on this occasion, I have yielded. I introduce the evaluation strategy to supplant1 my Triviomes: Treeviomes.
(Brief) Methodology
- Heartlessly throw the Triviomes section in the bin
- Generate a random
startDNA sequence - Generate a Newick format tree. The tree is a representation of the metahaplome that we will attempt to recover. Each branch (taxa) of the tree corresponds to a haplotype. The shape of the tree will be a star, with each branch of uniform length. Thus, the tree depicts a number of equally diverse taxa from a shared origin
- Use the tree to simulate evolution of the
startDNA sequence to create the haplotypes that comprise the synthetic metahaplome - As before, generate reads (of a given length, at some level of coverage) from each haplotype, and automatically generate the alignment (we know where our generated reads should start and end on the reference without external tools) and variant calls (any heterogeneous genomic position when the reads are piled up)
- Rinse and repeat, make pretty pictures
The foundation for this part of the work is set. Chris even recommended seq-gen as a tool that can simulate evolution from a starting DNA sequence, following a Newick tree, which I am using to generate our haplotypes. So I now have a push-buttan-to-metahaplome workflow that generates the necessary tree, haplotypes, and reads for testing Gretel.
I’ve had two main difficulties with Treeviomes…
• Throughput
Once again, running anything thousands of times has proven the bane of my life. Despite having a well defined workflow to generate and test a metahaplome, getting the various tools and scripts to work on the cluster here has been a complete pain in my arse. So much so, I ended up generating all of the data on my laptop (sequentially, over the course of a few days) and merely uploading the final BAMs and VCFs to our compute cluster to run Gretel. This has been pretty frustrating, especially when last weekend I set my laptop to work on creating a few thousand synthetic metahaplomes and promised some friends that I’d take the weekend off work for a change, only to find on Monday that my laptop had done exactly the same.
Option 1: Hard shitty hack to run quickly on cluster
Option 2: Easy shitty hack to run slowly on local
Option 3: @EveOnline#Bioinformatics— Sam Nicholls (@samstudio8) December 5, 2016
• Analysis
Rather unexpectedly, initial results raised more questions than answers. This was pretty unwelcome news following the faff involved in just generating and testing the many metahaplomes. Once Gretel‘s recoveries were finished (the smoothest part of the operation, which was a surprise in itself, given the presence of Sun Grid Engine), another disgusting munging script of my own doing spat out the convoluted plot below:
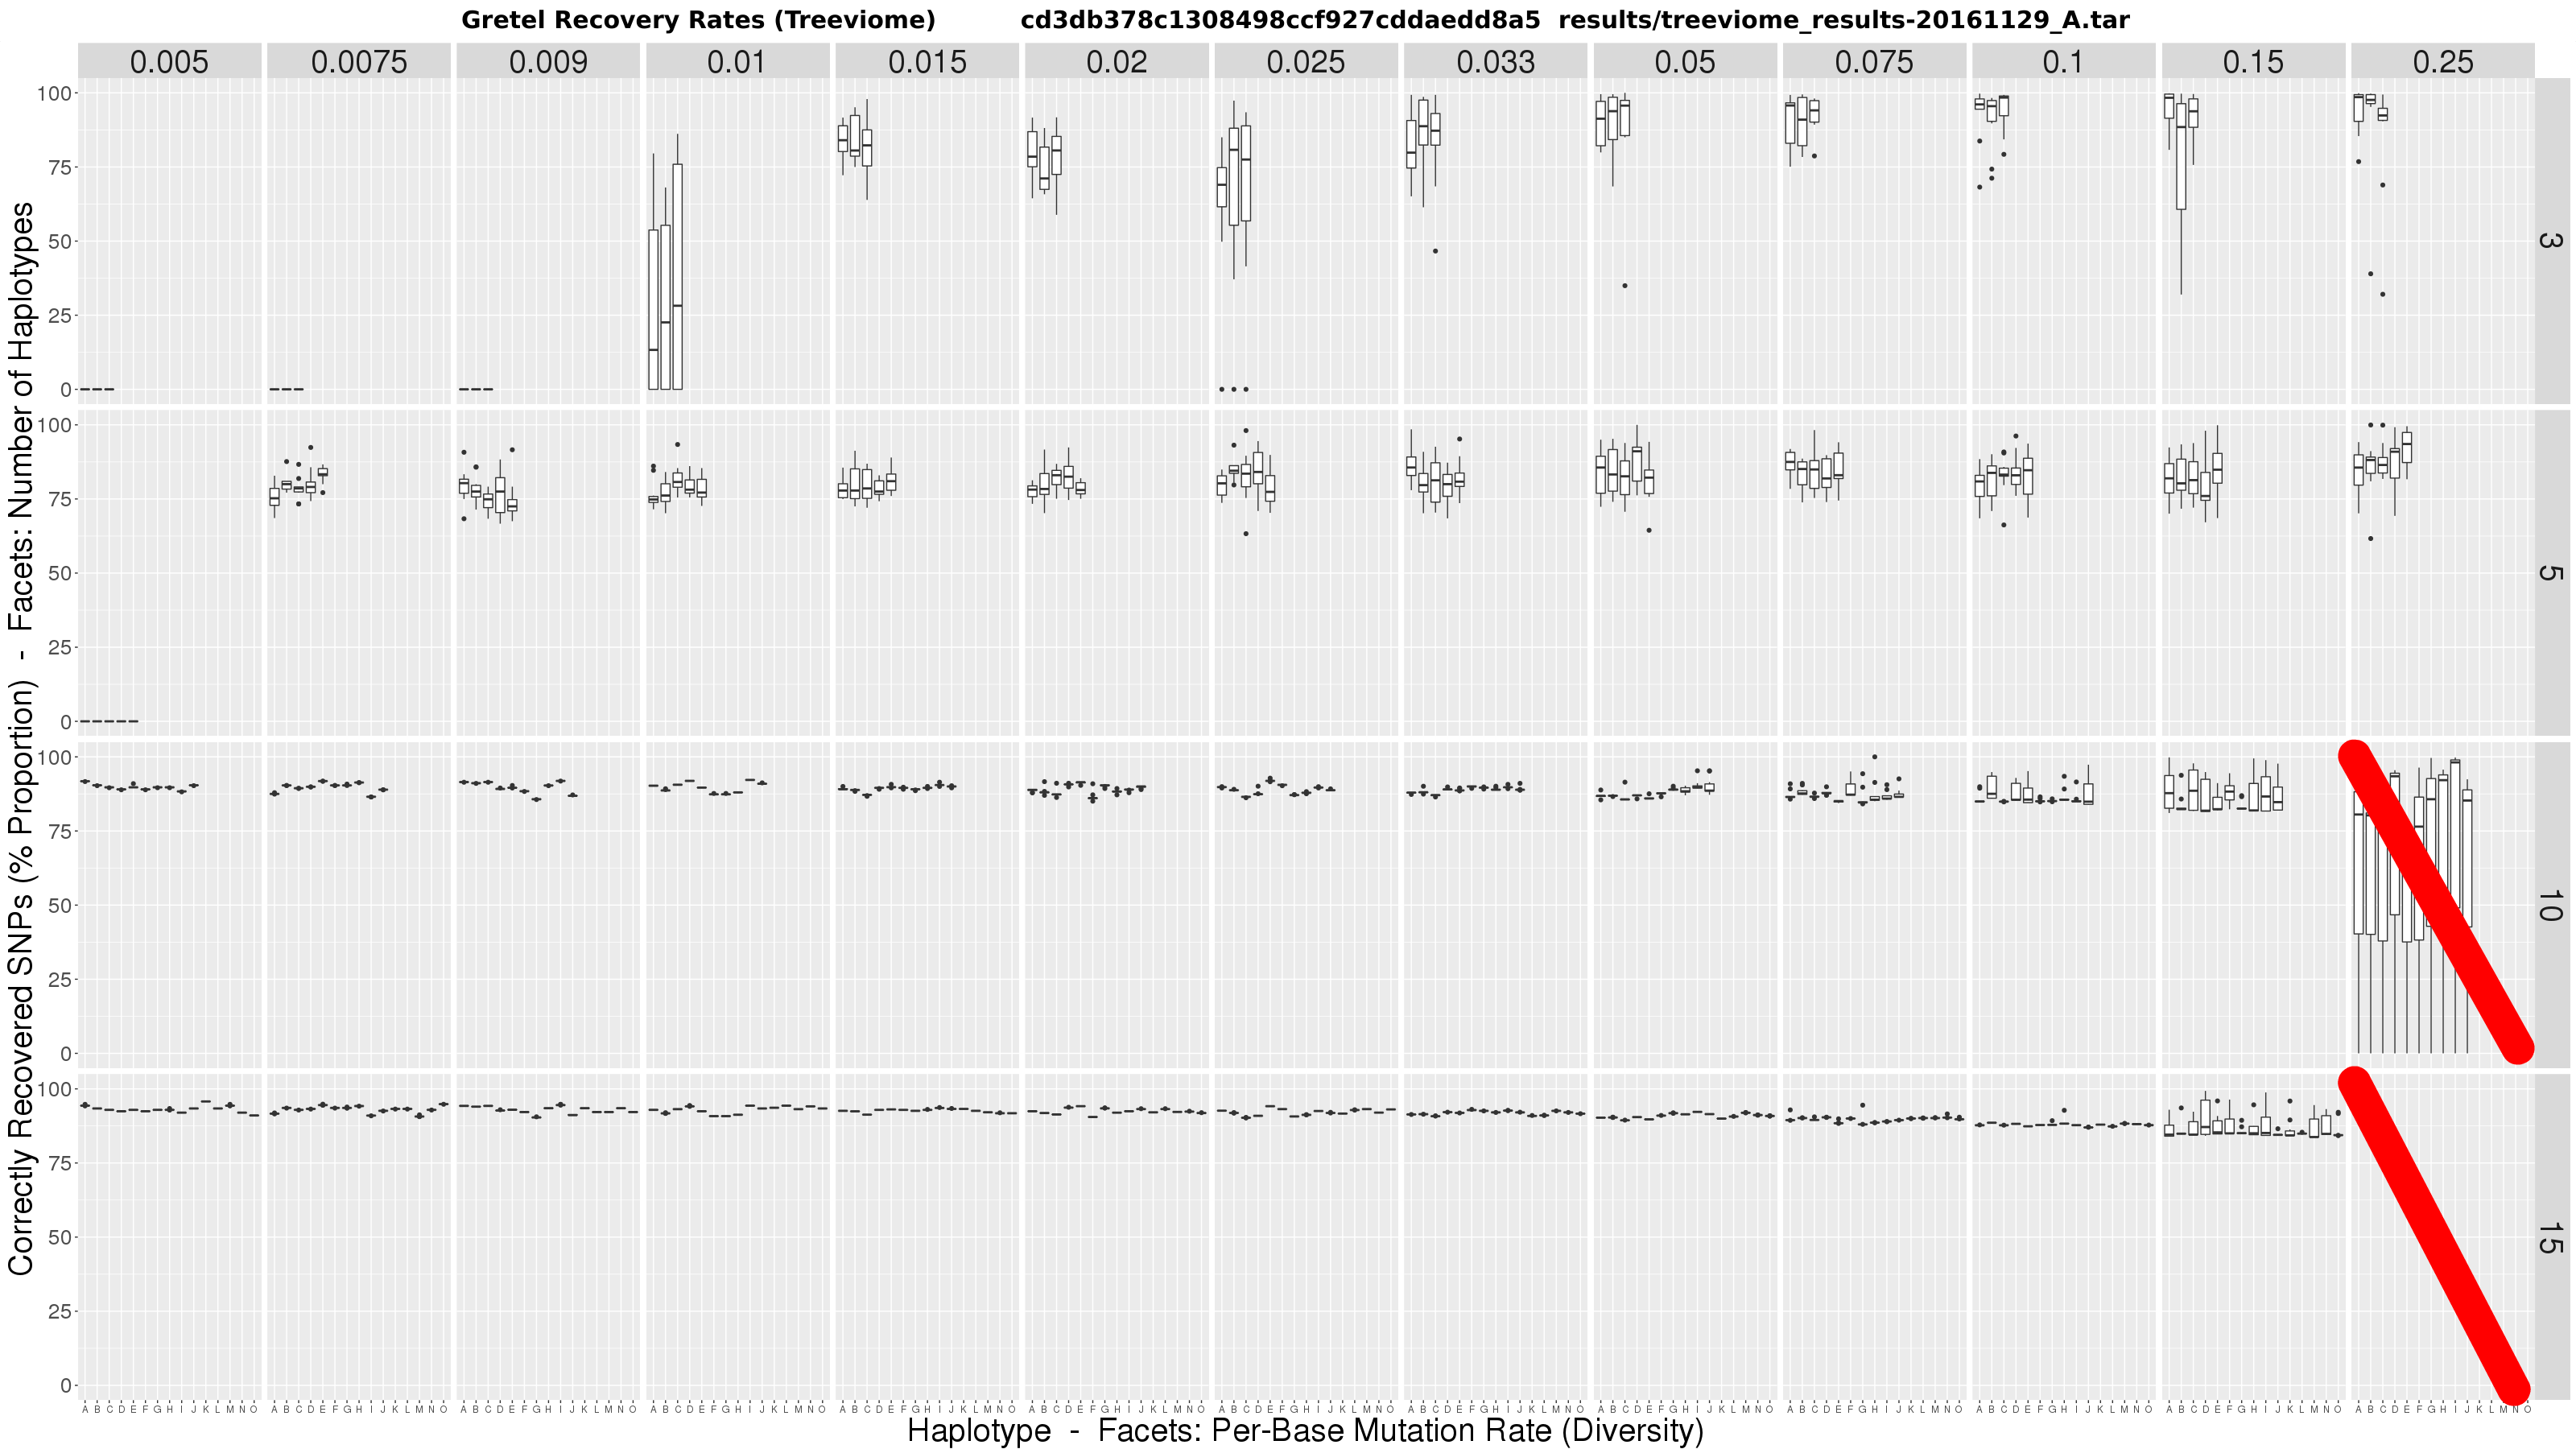
The figure is a matrix of boxplots where:
- Horizontal facets are the number of taxa in the tree (i.e. haplotypes)
- Vertical facets are per-haplotype, per-base mutation rates (i.e. the probability that any genomic position on any of the taxa may be mutated from the common origin sequence)
- X-axis of each boxplot represents each haplotype in the metahaplome, labelled A – O
- Y-axis of each boxplot quantifies the average best recovery rate made by
Gretelfor a given haplotype A – O, over ten executions ofGretel(each using a different randomly generated, uniformly distributed read set of 150bp at 7x per-haplotype coverage)
We could make a few wild speculations, but no concrete conclusions:
- At low diversity, it may be impossible to recover haplotypes, especially for metahaplomes containing fewer haplotypes
- Increasing diversity appears to create more variance in accuracy, but mean accuracy increases slightly in datasets with 3-5 haplotypes, but falls under 10+
- Increasing the number of haplotypes in the metahaplome appears to increase recovery accuracy
- In general, whilst there is variation, recovery rates across haplotypes is fairly clustered
- It is possible to achieve 100% accuracy for some haplotypes under high diversity, and few true haplotypes
The data is not substantial on the surface. But, if anything, I had seemed to refute my own pre-print. Counter-intuitively, we now seem to have shown that the problem is easier in the presence of more haplotypes, and more variation. I was particularly disappointed with the ~80% accuracy rates on mid-level diversity on just 3 haplotypes. Overall, comparing the recovery accuracy to that of my less realistic Triviomes, appeared worse.
This made me sad, but mostly cross.
Today has been a very bad day pic.twitter.com/3o23HKBAl9
— Sam Nicholls (@samstudio8) November 29, 2016
The beginning of the end of my sanity
I despaired at the apparent loss of accuracy. Where had my over 90% recoveries gone? I could feel my PhD pouring away through my fingers like sand. What changed here? Indeed, I had altered the way I generated reads since the pre-print, was it the new read shredder? Or are we just less good at recovering from more realistic metahaplomes? With the astute assumption that everything I am working on equating to garbage, I decided to miserably withdraw from my PhD for a few days to play Eve Online…
YES HELLO I AM AN @EVEONLINE WING COMMANDER NOW pic.twitter.com/3nujrinfxu
— Sam Nicholls (@samstudio8) December 7, 2016
I enjoyed my experiences of space. I began to wonder whether I should quit my PhD and become an astronaut, shortly before my multi-million ISK ship was obliterated by pirates. I lamented my inability to enjoy games that lack copious micromanagement, before accepting that I am destined to be grumpy in all universes and that perhaps for now I should be grumpy in the one where I have a PhD to write.
In retrospect, I figure that perhaps the results in my pre-print and the ones in our new megaboxplot were not in disagreement, but rather incomparable in the first place. Whilst an inconclusive conclusion on that front would not answer any of the other questions introduced by the boxplots, it would at least make me a bit feel better.
Scattering recovery rates by variant count
So I constructed a scatter plot to show the relationship between the number of called variants (i.e. SNPs), and best Gretel recovery rate for each haplotype of all of the tested metahaplomes (dots coloured by coverage level below), against the overall best average recovery rates from my pre-print (large black dots).
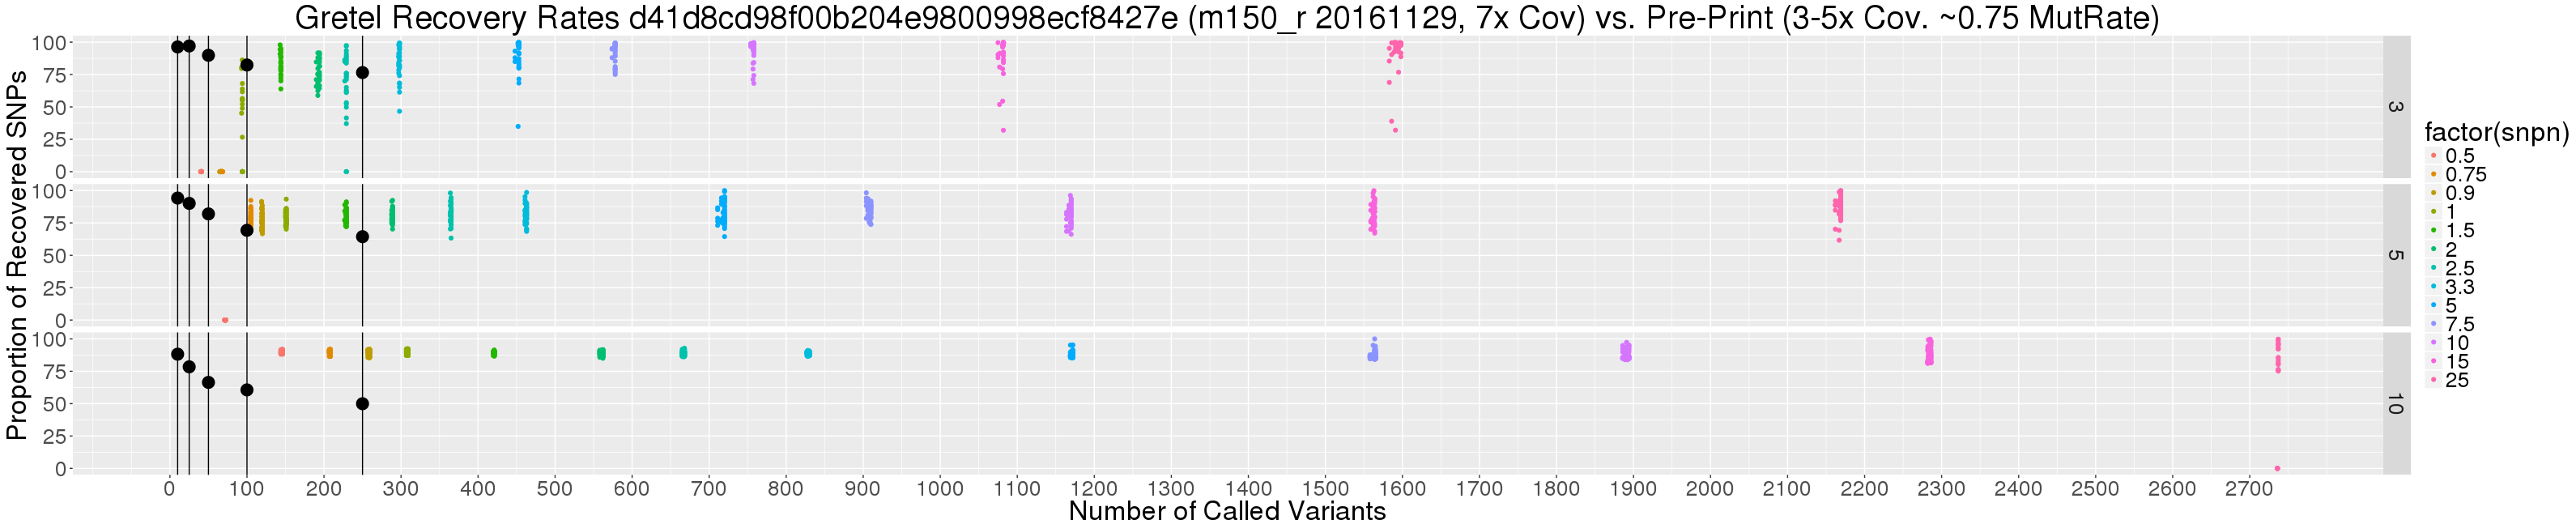
Immediately, it is obvious that we are discussing a difference in magnitude when it comes to numbers of called variants, particularly when base mutation rates are high. But if we are still looking for excuses, we can consider the additional caveats:
- Read coverage from the paper is 3-5x per haplotype, whereas our new data set uses a fixed coverage of 7x
- The number of variants on the original data sets (black dots) are guaranteed, and bounded, by their length (250bp max)
- Haplotypes from the paper were generated randomly, with equal probabilities for nucleotide selection. We can consider this as a 3 in 4 chance of disagreeing with the pseudo-reference: a 0.75 base mutation rate). The most equivalent subset of our new data consists of metahaplomes with a base mutation rate of “just” 0.25.
Perhaps the most pertinent point here is the last. Without an insane 0.75 mutation rate dataset, it really is quite sketchy to debate how recovery rates of these two data sets should be compared. This said, from the graph we can see:
- Those 90+% average recoveries I’m missing so badly belong to a very small subset of the original data, with very few SNPs (10-25)
- There are still recovery rates stretching toward 100%, particularly for the 3 haplotype data set, but for base mutation of 2.5% and above
- Actually, recovery rates are not so sad overall, considering the significant number of SNPs, particularly for the 5 and 10 haplotype metahaplomes
Recoveries are high for unrealistic variation
Given that a variation rate of 0.75 is incomparable, what’s a sensible amount of variation to concern ourselves with anyway? I ran the numbers on my DHFR and AIMP1 data sets; dividing the number of called variants on my contigs by their total length. Naively distributing the number of SNPs across each haplotype evenly, I found the magic number representing per-haplotype, per-base variation to be around 1.5% (0.015). Of course, that isn’t exactly a vigorous analysis, but perhaps points us in the right direction, if not the correct order of magnitude.
So the jig is up? We report high recovery rates for unnecessarily high variation rates (>2.5%), but our current data sets don’t seem to support the idea that Gretel needs to be capable of recovering from metahaplomes demonstrating that much variation. This is bad news, as conversely, both our megaboxplot and scatter plot show that for rates of 0.5%, Gretel recoveries were not possible in either of the 3 or 5 taxa metahaplomes. Additionally at a level of 1% (0.01), recovery success was mixed in our 3 taxa datasets. Even at the magic 1.5%, for both the 3 and 5 taxa, average recoveries sit uninterestingly between 75% and 87.5%.
Engineering, report pic.twitter.com/qiIjiF04gW
— Swear Trek (@swear_trek) December 15, 2016
Confounding variables are the true source of misery
Even with the feeling that my PhD is going through rapid unplanned disassembly with me still inside of it, I cannot shake off the curious result that increasing the number of taxa in the tree appears to improve recovery accuracy. Each faceted column of the megaboxplot shares elements of the same tree. That is, the 3 taxa 0.1 (or 1%) diversity rate tree, is a subtree of the 15 taxa 0.1 diversity tree. The haplotypes A, B and C, are shared. Yet why does the only reliable way to improve results among those haplotypes seem to be the addition of more haplotypes? In fact, why are the recovery rates of all the 10+ metahaplomes so good, even under per-base variation of half a percent?
We’ve found the trap door, and it is confounding.
Look again at the pretty scatter plot. Notice how the number of called variants increases as we increase the number of haplotypes, for the same level of variation. Notice that it is also possible to actually recover the same A, B, and C haplotype from 3-taxa trees, at low diversity when there are 10 or 15 taxa present.
Recall that each branch of our tree is weighted by the same diversity rate. Thus, when aligned to a pseudo-reference, synthetic reads generated from metahaplomes with more original haplotypes have a much higher per-position probability for containing at least one disagreeing nucleotide in a pileup. i.e. The number of variants is a function of the number of original haplotypes, not just their diversity.
The confounding factor is the influence of Gretel‘s lookback parameter: L. We automatically set the order of the Markov chain used to determine the next nucleotide variant given the last L selected variants, to be equal to the average number of SNPs spanned by all valid reads that populated the Hansel structure. A higher number of called variants in a dataset offers not only more pairwise evidence for Hansel and Gretel to consider (as there are more pairs of SNPs), but also a higher order Markov chain (as there are more pairs of SNPs, on the same read). Thus, with more SNPs, the hypothesis is Gretel has at her disposal, sequences of length L that are not only longer, but more unique to the haplotype that must be recovered.
It seems my counter-intuitive result of more variants and more haplotypes making the problem easier, has the potential to be true.
This theory explains the converse problem of being unable to recover any haplotypes from 3 and 5-taxa trees at low diversity. There simply aren’t enough variants to inform Gretel. After all, at a rate of 0.5%, one would expect a mere 5 variants per 1000bp. Our scatter plot shows for our 3000bp pseudo-reference, at the 0.5% level we observe fewer than 50 SNPs total, across the haplotypes of our 3-taxa tree. Our 150bp reads are not long enough to span the gaps between variants, and Gretel cannot make decisions on how to cross these gaps.
This doesn’t necessarily mean everything is not terrible, but it certainly means the megaboxplot is not only an awful way to demonstrate our results, but probably a poorly designed experiment too. We currently confound the average number of SNPs on reads by observing just the number of haplotypes, and their diversity. To add insult to statistical injury, we then plot them in facets that imply they can be fairly compared. Yet increasing the number of haplotypes, increases the number of variants, which increases the density of SNPs on reads, and improves Gretel‘s performance: we cannot compare the 3-taxa and 15-taxa trees of the same diversity in this way as the 15-taxa tree has an unfair advantage.
I debated with my resident PhD tree pervert about this. In particular, I suggested that perhaps the diversity could be equally split between the branches, such that synthetic read sets from a 3-taxa tree and 15-taxa tree should expect to have the same number of called variants, even if the individual haplotypes themselves have a different level of variation between the trees. Chris argued that whilst that would fix the problem and make the trees more comparable, but going against the grain of simple biological explanations would reintroduce the boilerplate explanation bloat to the paper that we were trying to avoid in the first place.
Around this time I decided to say fuck everything, gave up and wrote a shell for a little while.
Deconfounding the megabox
So where are we now? Firstly, I agreed with Chris. I think splitting the diversity between haplotypes, whilst yielding datasets that might be more readily comparable, will just make for more difficult explanations in our paper. But fundamentally, I don’t think these comparisons actually help us to tell the story of Hansel and Gretel. I thought afterwards, and there are other nasty, unobserved variables in our megaboxplot experiment that directly affect the density of variants on reads, namely: read length and read coverage. We had fixed these to 150bp and 7x coverage for the purpose of our analysis, which felt like a dirty trick.
At this point, bioinformatics was starting to feel like a grand conspiracy, and I was in on it. Would it even be possible to fairly test and describe how our algorithm works through the noise of all of these confounding factors?
Me explaining bioinformatics pic.twitter.com/9skNMssNie
— Sam Nicholls (@samstudio8) November 29, 2016
I envisaged the most honest method to describe the efficacy of my approach, as a sort of lookup table. I want our prospective users to be able to determine what sort of haplotype recovery rates might be possible from their metagenome, given a few known attributes, such as read length and coverage, at their region of interest. I also feel obligated to show under what circumstances Gretel performs less well, and offer reasoning for why. But ultimately, I want readers to know that this stuff is really fucking hard.
Introducing the all new low-fat less-garbage megaboxplot
Here is where I am right now. I took this lookup idea, and ran a new experiment consisting of some 1500 sets of reads, and runs of Gretel, and threw the results together to make this:
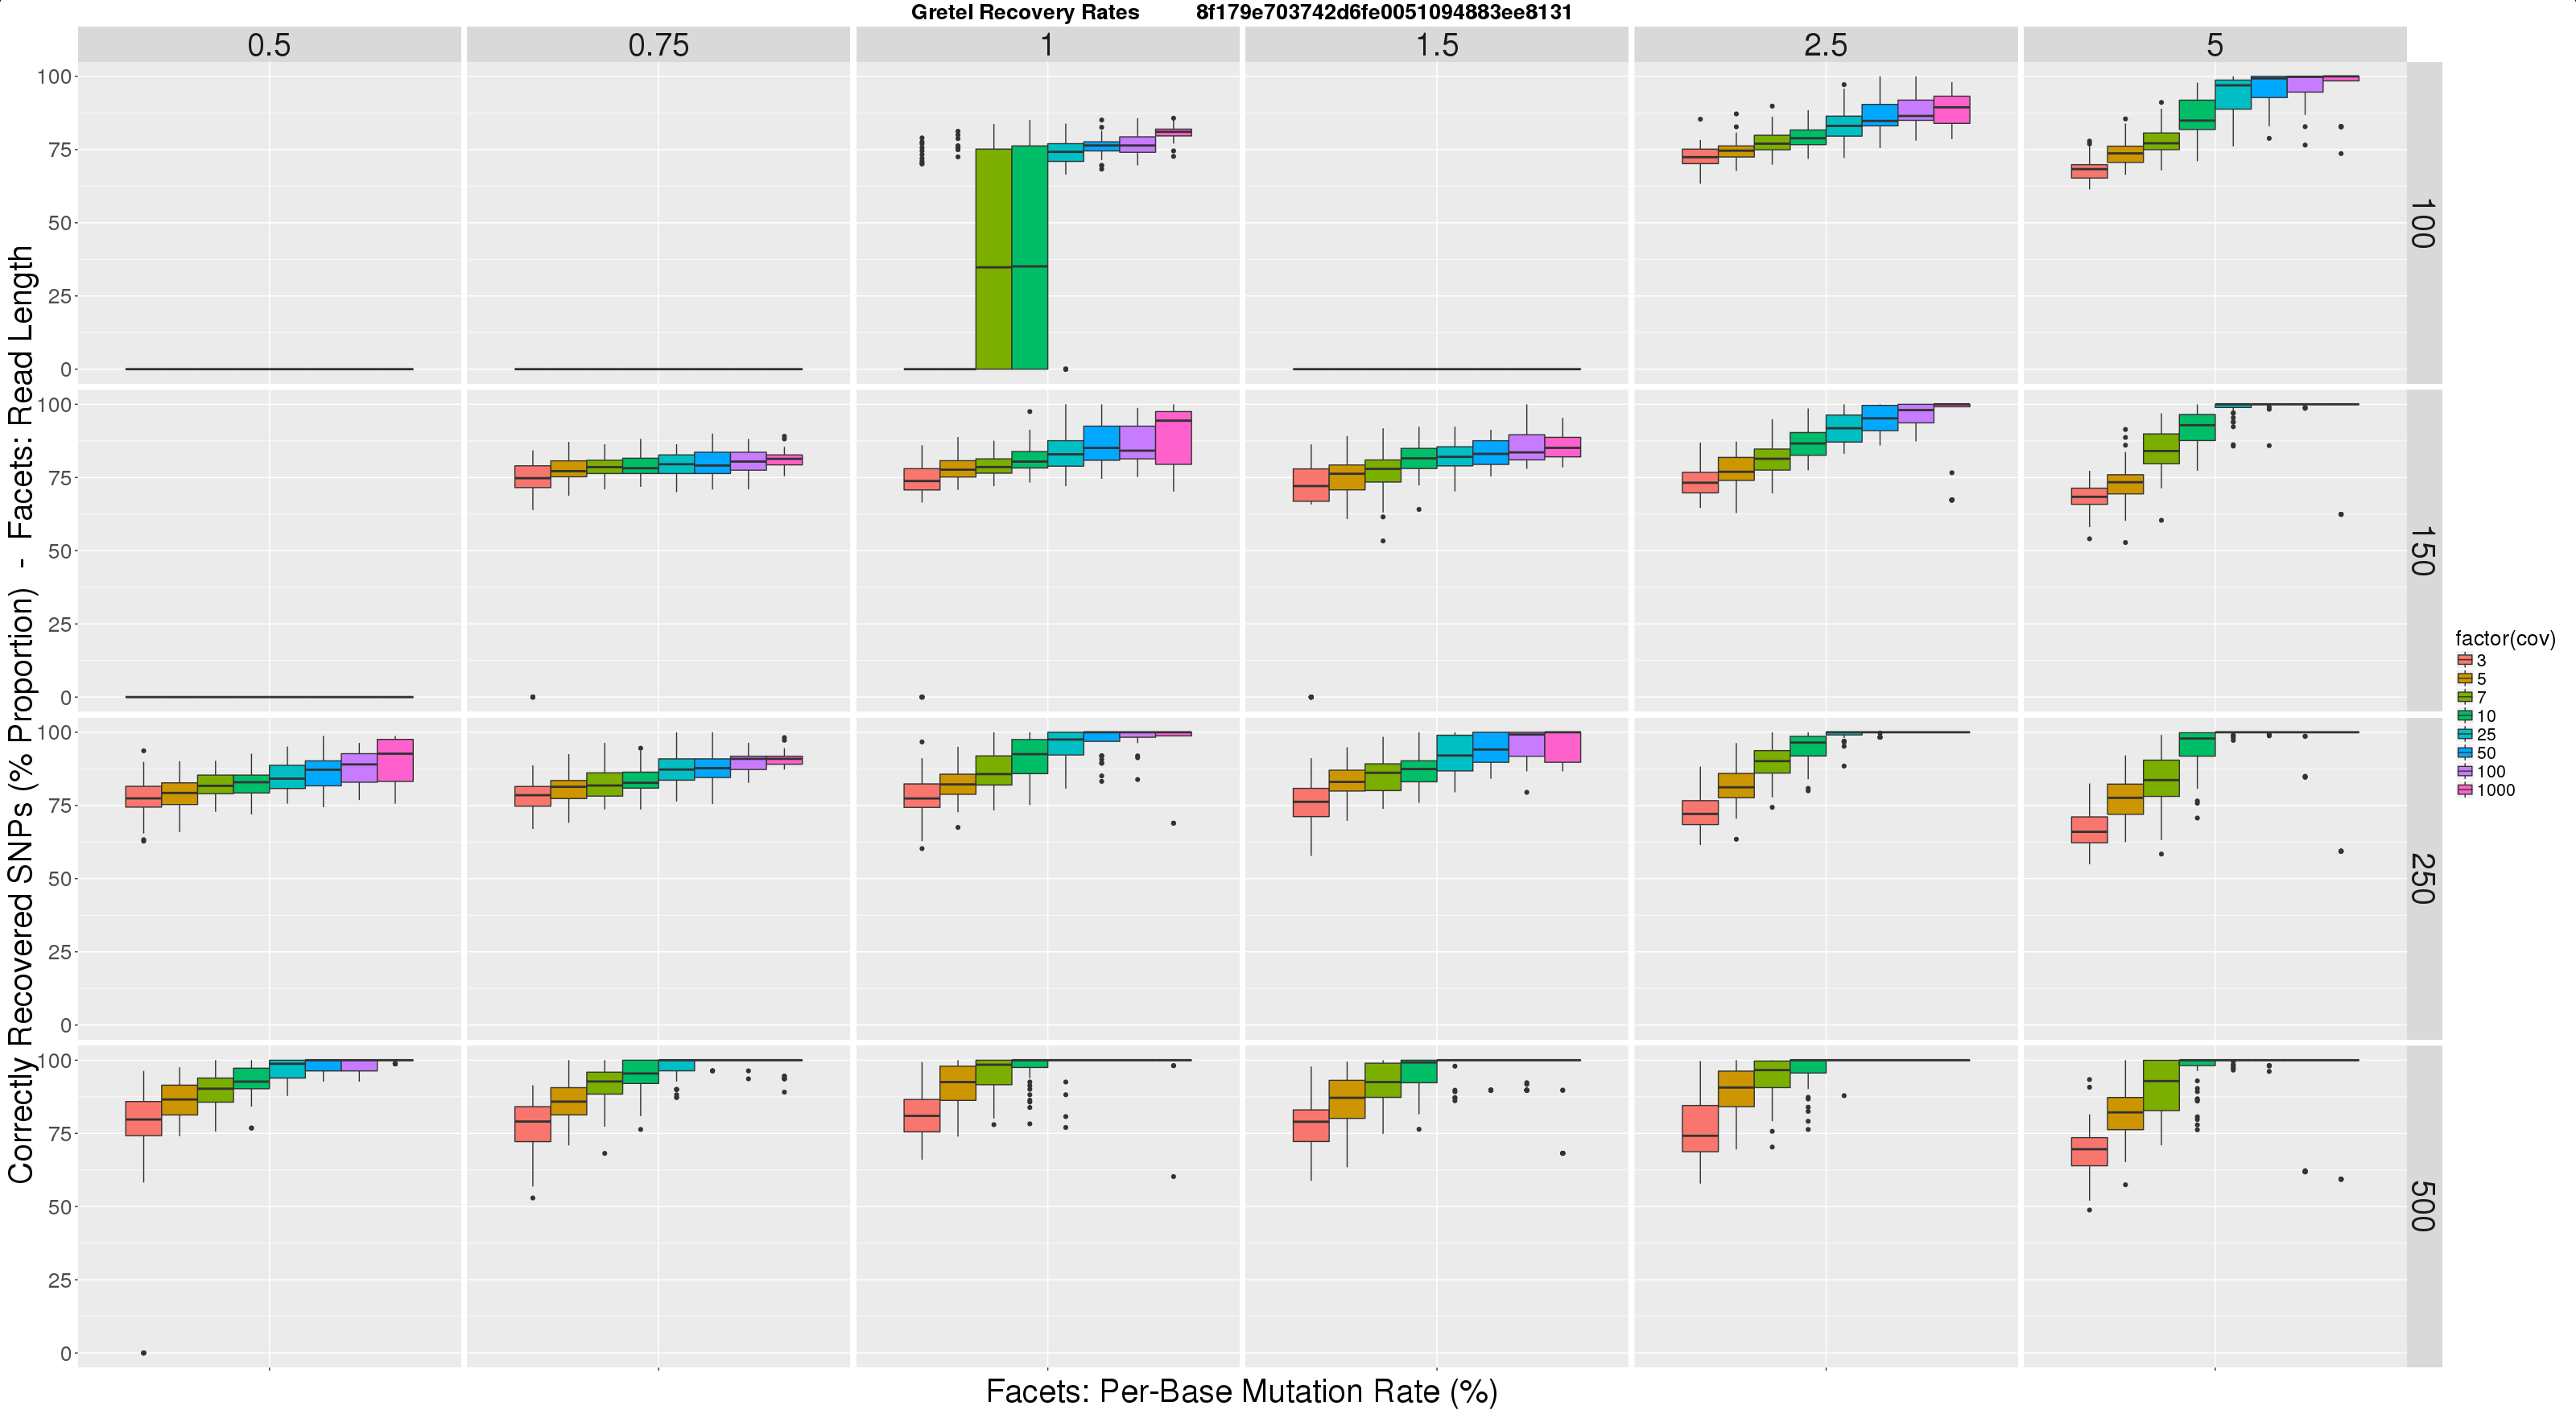
- Horizontal facets represent synthetic read length
- Vertical facets are (again) per-haplotype, per-base mutation rates, this time expressed as a percentage (so a rate of 0.01, is now 1%)
- Colour coded X-axis of each boxplot depicts the average per-haplotype read coverage
- Y-axis of each boxplot quantifies the average best recovery rate made by
Gretelfor all of the five haplotypes, over ten executions ofGretel(each using a different randomly generated, uniformly distributed read set)
I feel this graph is much more tangible to users and readers. I feel much more comfortable expressing our recovery rates in this format, and I hope eventually our reviewers and real users will agree. Immediately we can see this figure reinforces some expectations, primarily increasing the read length and/or coverage, has a large improvement on Gretel‘s performance. Increasing read length also lowers the requirements on coverage for accuracy.
This seems like a reasonable proof of concept, so what’s next?
- Generate a significant amount more input data, preferably in a way that doesn’t make me feel ill or depressed
- Battle with the cluster to execute more experiments
- Generate many more pretty graphs
I’d like to run this test for metahaplomes with a different number of taxa, just to satisfy my curiosity. I also want to investigate the 1 – 2% diversity region in a more fine grain fashion. Particularly important will be to repeat the experiments with multiple metahaplomes for each read length, coverage and sequence diversity parameter triplet, to randomise away the influence of the tree itself. I’m confident this is the reason for inconsistencies in the latest plot, such as the 1.5% diversity tree with 100bp reads yielding no results (likely due to this particular tree generating haplotypes such that piled up reads contain a pair of variants more than 100bp apart).
Conclusion
- Generate more fucking metahaplomes
- Get this fucking paper out
tl;dr
- I don’t want to be doing this PhD thing in a year’s time
- I’ve finally started looking again at our glorious rejected pre-print
- The Trivial haplomes tanked, they were too hard to explain to reviewers and actually don’t provide that much context on
Gretelanyway - New tree-based datasets have superseded the triviomes2
- Phylogenetics maybe isn’t so bad (but I’m still not sure)
- Once again, the cluster and parallelism in general has proven to be the bane of my fucking life
- It can be quite difficult to present results in a sensible and meaningful fashion
- There are so many confounding factors in analysis and I feel obligated to control for them all because it feels like bad science otherwise
- I’m fucking losing it lately
- Playing spaceships in space is great but don’t expect to not be blown out of fucking orbit just because you are trying to have a nice time
- I really love
ggplot2, even if the rest ofRis garbage - I’ve been testing
Gretelat “silly” levels of variation thinking that this gives proof that we are good at really hard problems, but actually more variation seems to make the problem of recovery easier 1.5%per-haplotype per-base mutation seems to be my current magic number (n=2, because fuck you)- I wrote a shell because keeping track of all of this has been an unmitigated clusterfuck
- I now have some plots that make me feel less like I want to jump off something tall
- I only seem to enjoy video games that have plenty of micromanagement that stress me out more than my PhD
- I think Bioinformatics PhD Simulator 2018 would make a great game
- Unrealistic testing cannot give realistic answers
- My supervisor, Chris is a massive dendrophile3
- HR bullshit makes a grumpy PhD student much more grumpy
- This stuff, is really fucking hard